Overview:
Prometheus: An open-source monitoring and alerting toolkit designed to collect and store metrics as time series data for reliability and scalability.
Grafana: An open-source analytics and monitoring platform that visualizes data from various sources, creating interactive dashboards and alerts.
Node Exporter: A Prometheus exporter that provides detailed hardware and OS metrics from *nix systems, enabling detailed monitoring of system performance.
Alertmanager: A component of Prometheus that handles alerts by deduplicating, grouping, and routing them to various notification channels.
The below Docker Compose file is set up to deploy a monitoring stack using Prometheus, Grafana, Node Exporter, and Alertmanager.
Step 1: Open the editor by using vim or nano and save it as docker-compose.yml
Here is the full yml file for docker compose.
sudo nano docker-compose.yml
version: '3'
services:
prometheus:
image: prom/prometheus
ports:
- "9090:9090"
volumes:
- ./prometheus:/etc/prometheus
command:
- '--config.file=/etc/prometheus/prometheus.yml'
networks:
- monitoring
grafana:
image: grafana/grafana
ports:
- "3000:3000"
environment:
- GF_SECURITY_ADMIN_PASSWORD=P@ssw0rd
networks:
- monitoring
node_exporter:
image: prom/node-exporter
ports:
- "9101:9100"
networks:
- monitoring
alertmanager:
image: prom/alertmanager
ports:
- "9093:9093"
volumes:
- ./alertmanager:/etc/alertmanager
command:
- '--config.file=/etc/alertmanager/alertmanager.yml'
networks:
- monitoring
networks:
monitoring:
driver: bridge
Refer to the below table for better understanding.,
|
Grafana |
Prometheus |
Node Exporter |
Alertmanager |
|
|
Image |
grafana/grafana |
prom/prometheus |
prom/node-exporter |
prom/alertmanager |
|
Port |
3000:3000 |
9090:9090 |
9101:9100 |
9093:9093 |
|
Volume |
|
./prometheus |
|
./alertmanager |
|
Network |
Monitoring/Bridge |
|||
Note: In the specified node exporter image, we expose the port as 9101 instead of the default port (9100).Because when we install node exporter in the local host it will throw an error as the port is already in use.
Step 2: Start the docker service
sudo docker-compose up -d
Step 3: Ensure the directories ./prometheus and ./alertmanager exist and have the correct configurations (prometheus.yml and alertmanager.yml respectively).
Step 4: Go to the Prometheus directory and create alert.yml file
sudo nano alert.yml
Paste the below rules: whenever the machine is off-stage and memory, CPU increases above 80% the alert is triggered.(Both Linux and Windows server rules)
groups:
- name: alert.rules
rules:
- alert: InstanceDown
expr: up == 0
for: 1m
labels:
severity: "critical"
annotations:
summary: "Endpoint {{ $labels.instance }} down"
description: "{{ $labels.instance }} of job {{ $labels.job }} has been down for more than 1 minutes."
- alert: HostOutOfMemory
expr: node_memory_MemAvailable_bytes / node_memory_MemTotal_bytes * 100 < 20
for: 5m
labels:
severity: warning
annotations:
summary: "Host out of memory (instance {{ $labels.instance }})"
description: "Node memory is filling up (< 25% left)\n VALUE = {{ $value }}\n LABELS: {{ $labels }}"
- alert: HostOutOfMemory
expr: windows_os_physical_memory_free_bytes / windows_cs_physical_memory_bytes * 100 < 20
for: 5m
labels:
severity: warning
annotations:
summary: "Host out of memory (instance {{ $labels.instance }})"
description: "Node memory is filling up (< 25% left)\n VALUE = {{ $value }}\n LABELS: {{ $labels }}"
- alert: HostHighCpuLoad
expr: (sum by (instance) (irate(node_cpu{job="node_exporter_metrics",mode="idle"}[5m]))) > 80
for: 5m
labels:
severity: warning
annotations:
summary: "Host high CPU load (instance {{ $labels.instance }})"
description: "CPU load is > 80%\n VALUE = {{ $value }}\n LABELS: {{ $labels }}"
- alert: HostHighCpuLoad
expr: 100 - (avg by (instance) (irate(windows_cpu_time_total{mode="idle", instance=~"$server"}[1m])) * 100) > 80
for: 5m
labels:
severity: warning
annotations:
summary: "Host high CPU load (instance {{ $labels.instance }})"
description: "CPU load is > 80%\n VALUE = {{ $value }}\n LABELS: {{ $labels }}"
Step 5:
Now create prometheus.yml file inside the Prometheus directory and update the required monitoring servers.
sudo nano prometheus.yml
# Alertmanager configuration
alerting:
alertmanagers:
- static_configs:
- targets:
- localhost:9093
# Load rules once and periodically evaluate them according to the global 'evaluation_interval'.
rule_files:
- alert_rules.yml
# - "second_rules.yml"
scrape_configs:
- job_name: 'prometheus'
static_configs:
- targets: ['localhost:9090'] # Prometheus itself
- job_name: 'node_exporter'
static_configs:
- targets:[ # Internal server running Node Exporter'xxxxx:9100','yyyyyyyyy:9182']
Step 6:
Make sure to install the node/win exporter to the servers to be monitored.
Check by,
Linux:localhost:9100
Windows:localhost:9182
Step 7:
Now create the mail configuration. Go to the alertmanager directory and create alertmanager.yml file.
sudo nano alertmanager.yml
global:
resolve_timeout: 5m
route:
receiver: 'alert'
group_by: ['instance', 'alert']
group_wait: 30s
group_interval: 5m
repeat_interval: 3h
receivers:
- name: 'alert'
email_configs:
- to:
from:
smarthost: 'smtp.office365.com:587'
auth_username:
auth_password: 'xxxxxxxxxx'
Step 8:
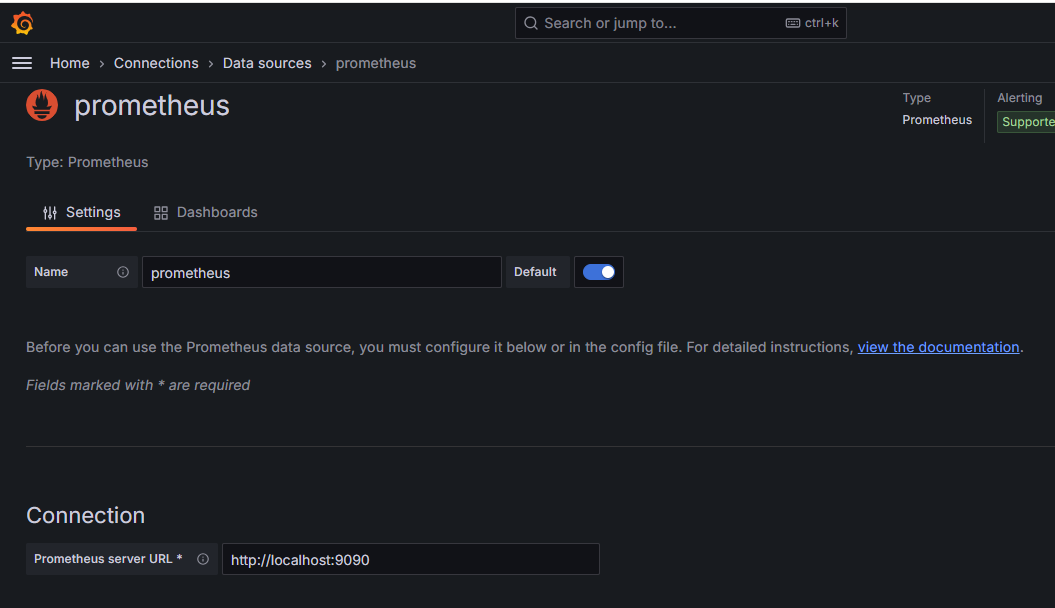
Go to the Grafana dashboard under the menu and select the data source as Prometheus.,
Home>Connection>Data Source>prometheus
To update the Prometheus URL, Click the save and test option to verify.
Step 9:
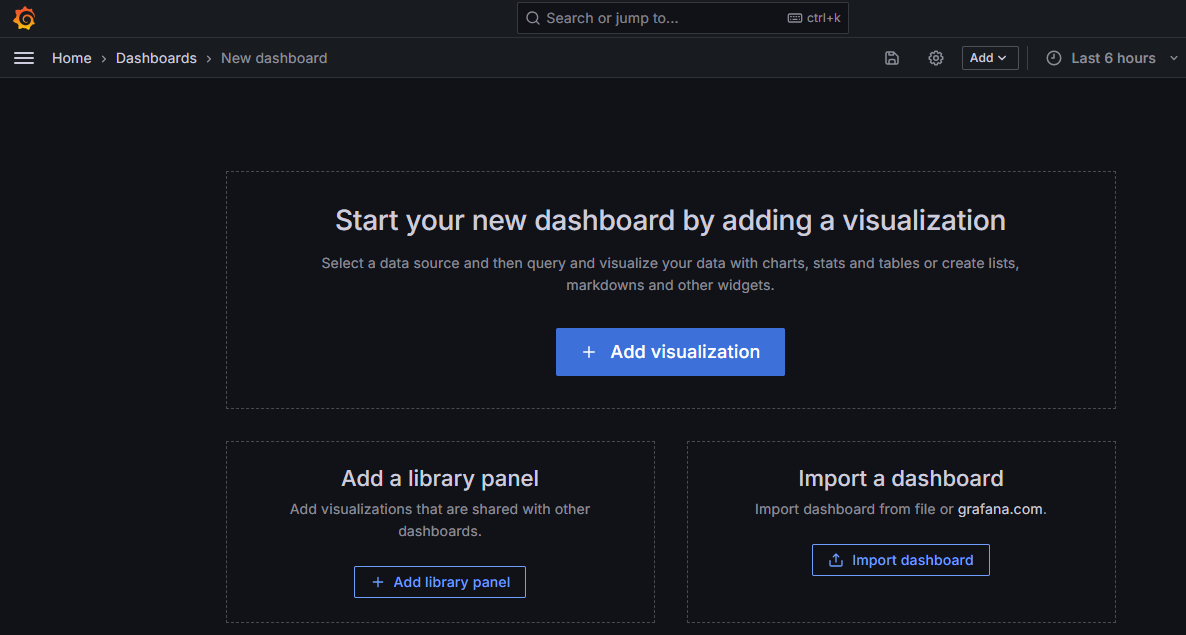
Go to the New dashboard and select the following option to proceed. For example, Here we used an import a dashboard option.
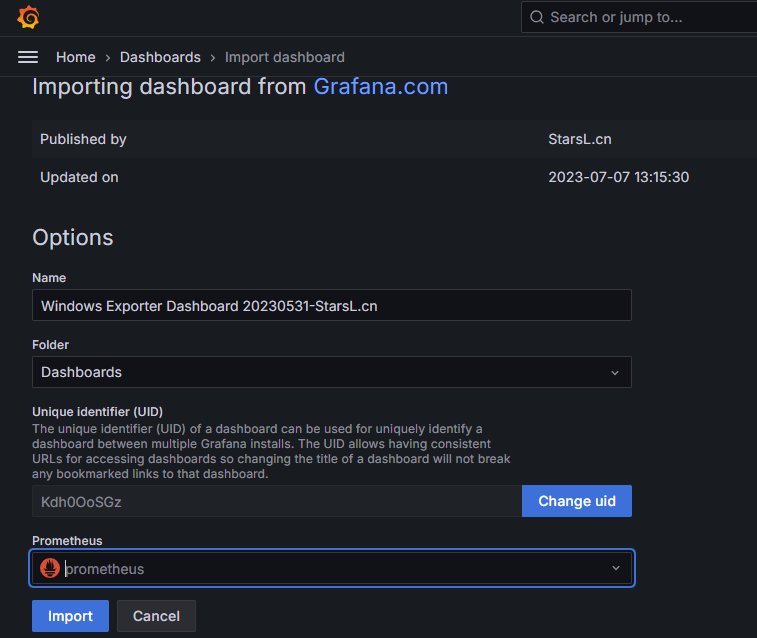
It is readily available ., To enter the ID to load the dashboard.
For Windows -10467
For Linux-11074


Step 10:
We use the volume option in our compose file. If you want to add or remove any server, do not login to the docker container. Instead, enter the server details outside the Prometheus folder.
Once done just restart the container.

