Grafana is an open-source platform for monitoring and observability, allowing users to visualize metrics from various data sources, including MySQL and Node.js applications. By integrating MySQL as a data source, you can track database performance, query times, and resource usage.
For Node.js, Grafana can visualize application metrics like response times, error rates, and system performance. Together, these tools help developers and operations teams maintain optimal performance and quickly identify issues.
We can install and configure Grafana, Promethues to Linux server and collect the metrics for all servers and display through Grafana dashboard. To monitor any particular services we need to install the corresponding exporter(metrics collection) in the destination server.
Step 1: Ensure the docker service running in the proposed Grafana server.
#sudo systemctl status docker.
Step 2: Open the editor and create the below yml file as docker-compose.yml. Here we create 4 containers for Grafana, Prometheus, MySQL exporter, and Nodejs.
#sudo nano docker-compose.yml
version: '3'
services:
 prometheus:
   image: prom/prometheus:latest
   container_name: prometheus
   ports:
     - "9090:9090"
   volumes:
     - ./prometheus:/etc/prometheus
     - prometheus_data:/prometheus
   command:
     - '--config.file=/etc/prometheus/prometheus.yml'
   networks:
     - monitoring
 grafana:
   image: grafana/grafana:11.0.0
   container_name: grafana
   ports:
     - "3000:3000"
   environment:
     - GF_SECURITY_ADMIN_PASSWORD=P@ssw0rd
   networks:
     - monitoring
 mysql_exporter:
   image: prom/mysqld-exporter:latest
   container_name: mysql_exporter
   ports:
     - "9104:9104"
   environment:
     - DATA_SOURCE_NAME=root:xxxxxxxx@(mysql:3306)/
   volumes:
     - ./sql.txt:/etc/mysql_exporter/sql.txt:ro
   command:
     - '--config.my-cnf=/etc/mysql_exporter/sql.txt'
   networks:
     - monitoring
 nodejs:
   image: node:latest
   container_name: nodejs
   ports:
     - “8080:8080”
   volumes:
     - ./nodejs-app:/usr/src/app
   networks:
     - monitoring
   working_dir: /usr/src/app
   command: "npm start"
volumes:
 prometheus_data:
 mysql_data:
networks:
 monitoring:
   driver: bridge
Step 3: Now we have to create the volumes based on the above configuration file.
Step 4:
Now Update the Prometheus configuration.
#sudo mkdir prometheus
#cd /prometheus
#sudo vim prometheus.yml
Save the below configuration of MySQL and NodeJS.
scrape_configs:
 - job_name: 'prometheus'
   static_configs:
     - targets: ['localhost:9090']  # Prometheus itself
 - job_name: mysql_db
   static_configs:
     - targets: ['localhost:9104','serverip:9104','serverip:9104']
       labels:
         alias: db1
 - job_name: "nodejs-app"
   static_configs:
     - targets: ['localhost:8080','serverip:8085','serverip:8085']
Step 5: Now provide mysql db username and password here.
[client]
user=root
password=xxxxxx
Step 6: Install nodejs promclient packages
#cd /nodejs-app
#npm init
![]()
#sudo vim server.js
const http = require('http');
const url = require('url');
const client = require('prom-client');
// Create a Registry which registers the metrics
const register = new client.Registry();
// Add a default label which is added to all metrics
register.setDefaultLabels({
 app: 'example-nodejs-app'
});
// Enable the collection of default metrics
client.collectDefaultMetrics({ register });
// Create a histogram metric
const httpRequestDurationMicroseconds = new client.Histogram({
 name: 'http_request_duration_seconds',
 help: 'Duration of HTTP requests in microseconds',
 labelNames: ['method', 'route', 'code'],
 buckets: [0.1, 0.3, 0.5, 0.7, 1, 3, 5, 7, 10]
});
// Register the histogram
register.registerMetric(httpRequestDurationMicroseconds);
// Define the HTTP server
const server = http.createServer(async (req, res) => {
 // Start the timer
 const end = httpRequestDurationMicroseconds.startTimer();
 // Retrieve route from request object
 const route = url.parse(req.url).pathname;
 if (route === '/metrics') {
   // Return all metrics in the Prometheus exposition format
   res.setHeader('Content-Type', register.contentType);
   const metrics = await register.metrics(); // Await the Promise
   res.end(metrics); // Send the metrics
 } else {
   res.statusCode = 404;
   res.end('Not found');
 }
 // End timer and add labels
 end({ route, code: res.statusCode, method: req.method });
});
// Start the HTTP server which exposes the metrics on http://localhost:8080/metrics
server.listen(8080);
Step 7: Finally, our configuration workflow looks like this. Kindly confirm.
![]()
Step 8: Up the container by below command
#sudo docker-compose up -d
Step 9:Check the docker container status by
#sudo docker ps -a
Step 10: Create MySQL and NodeJS exporter to agent server.
Refer below URL for configuring MySQL exporter .
Install and Configure Prometheus MySQL Exporter - DevOpsSchool.com
Repeat step 6 for NodeJS exporter.
Step 11: Login to the Grafana dashboard via GUI of any PC.
Step 12:Click import dashboard to import the MySQL and NodeJS dashboard.
Note: Dashboard available in Grafana cloud registry
https://grafana.com/grafana/dashboards/
FYR:
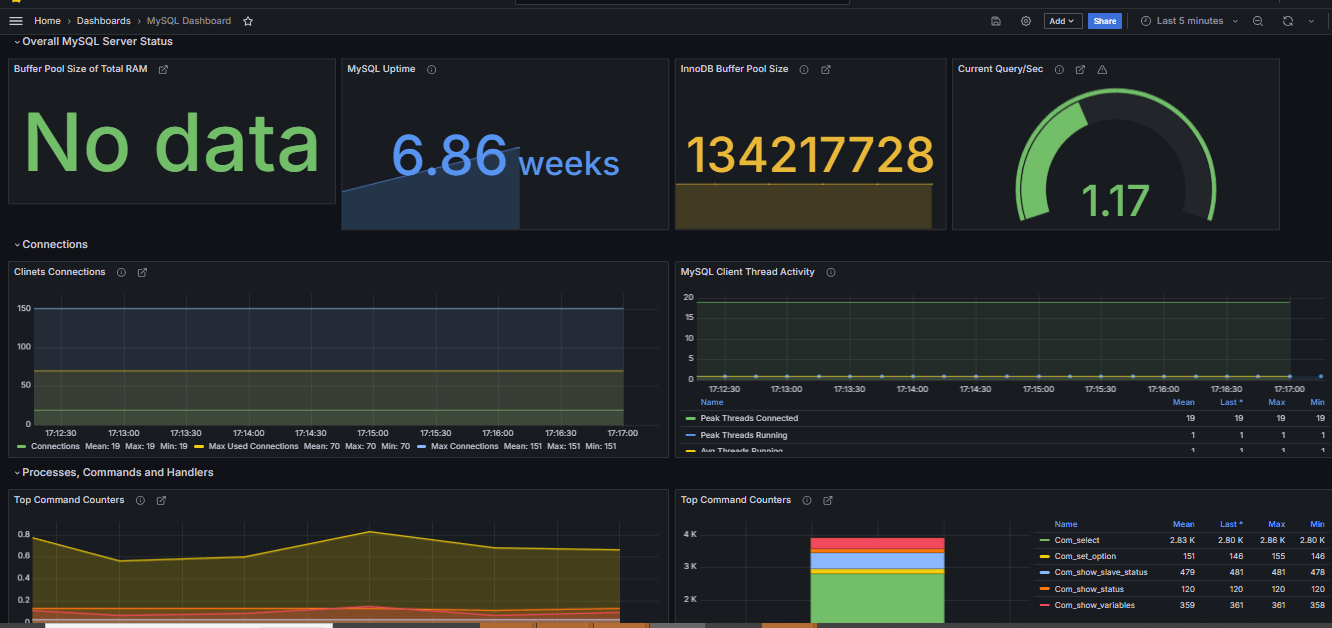
MySQL:14031-https://grafana.com/grafana/dashboards/14031-mysql-dashboard/
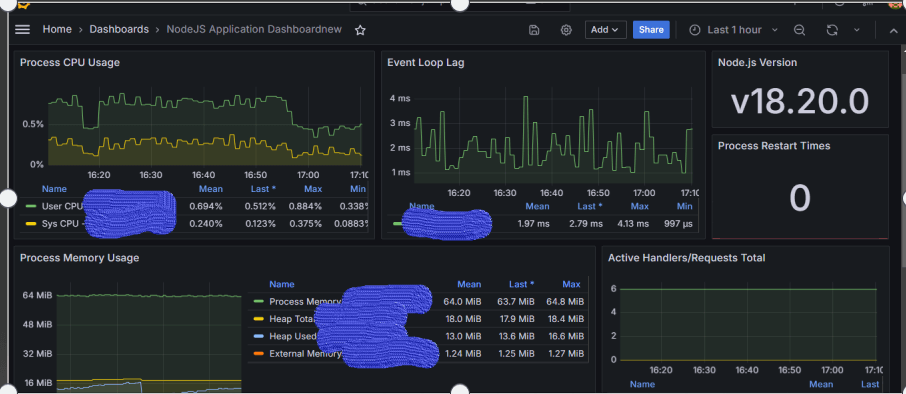
NodeJS:11159-https://grafana.com/grafana/dashboards/11159-nodejs-application-dashboard/